

How to Use System Logs to Detect Suspicious Automation
Suspicious Patterns Hiding in Plain Sight

There wasn’t a breach. Not officially. No alerts fired. No incidents declared. Just a stale script left behind by a former engineer, still running quietly every day at 3:17am — pulling sensitive data into a forgotten S3 bucket.
No one noticed. Not until an unrelated audit turned it up months later.
This is the quiet problem with automation in modern infrastructure: it works until it doesn't. And because it’s automated, it’s invisible — running under service accounts, buried in CI pipelines, embedded in cron jobs and Terraform modules no one wants to touch.
Security incidents don’t always start with external threats. Sometimes they start with your own automation behaving exactly as it was designed — in environments no one monitors, with credentials no one has rotated, doing things no one remembers authorizing.
The good news? Most of that behavior leaves a trace.
System logs — whether they’re local (auditd, syslog), cloud-native (CloudTrail, GCP Logging), or baked into CI tooling — already contain the signals you need to detect rogue automation. The problem is that we treat logs as forensic tools instead of active insight.
This tutorial will walk through how to use logs to:
Spot suspicious patterns that look like scripts, not humans
Detect high-frequency or repetitive access anomalies
Identify credential reuse and privilege creep
And turn boring system noise into meaningful security signal
No SIEM required. No buzzword bingo. Just real patterns, commands, and workflows you can use — because the best time to catch unauthorized automation is before it becomes a Slack thread with too many people tagged.
What to Look For: Red Flags in Logs
Not all automation is suspicious. But suspicious automation is almost always detectable — if you know what to look for.
Logs won’t give you intent. But they’ll give you behavior. And behavior is where weird patterns show up. Below are five signals that often indicate unmonitored, misused, or forgotten automation — the kind that quietly undermines access controls, compliance policies, and trust boundaries.
1. Unusual Frequency or Timing
A real user doesn’t hit the same endpoint every 7 seconds at 3:17am. But a leftover cron job will.
What to check:
journalctlorauditdlogs for recurring timestampsCloudTrail or GCP Logging for API actions with tight intervals
Watch for exact repetition in access frequency (e.g. every X seconds)
Why it matters:
Scripts often run at fixed intervals with no human rhythm. If something’s firing at the same time daily or hitting an endpoint 500 times/hour, it’s likely scripted — and possibly forgotten.
2. Repeated Access to the Same Endpoint or File
A looped script scraping the same API. A misconfigured backup tool reading from a sensitive directory 24/7.
What to check:
Cloud logs showing the same path/IP/resource being hit repeatedly
File-level logs for redundant read ops (Linux:
auditdwith-wflags)
Behavior example:
Same IP + same URL (e.g.
/users/export) every 30 seconds = likely automationSame service account downloading the same S3 object repeatedly = likely misconfigured job
Why it matters:
This is a favorite exfiltration pattern: read-only automation that flies under the radar because it isn’t "doing damage" — until you realize it’s leaking data at scale.
3. Credential Reuse Across Environments
When the same API key shows up in logs for both staging and prod, something’s wrong.
What to check:
CloudTrail logs: look for identical AccessKeys or tokens across unrelated environments
CI/CD logs: same service account or OIDC identity used in multiple pipelines
Why it matters:
This usually points to scripts reusing static credentials, which violates least privilege and creates a single point of compromise. It's also often a sign of shadow automation — jobs built outside IaC visibility.
4. Process Names That Don’t Match Behavior
pythonlaunchingcurlnodelaunchingbashnpm installtriggeringscporwget
What to check:
auditdrules for child process tracingEDR logs or syscall monitoring
Use
ausearch -xin Linux to trace unexpected binaries launched
Why it matters:
Scripts often stitch together tools that weren’t meant to be used together. If a Node.js app starts shelling out to curl, you’re either looking at custom automation — or a breach.
5. Noisy but Benign-Looking Requests
Exfiltration doesn’t always look malicious. Sometimes it’s just thousands of GET or SELECT operations targeting high-value tables or assets — all technically “read-only,” all perfectly logged, none reviewed.
What to check:
API logs for volume-based anomalies: e.g. 10,000
GETrequests in a 10-minute windowDatabase logs (PostgreSQL, MySQL) for SELECT-heavy traffic outside of normal query profiles
Cloud-native DLP tools if available
Why it matters:
The worst exfil is the kind that looks like a backup job. If a compromised script is pulling data slowly enough to avoid rate limits but fast enough to dump sensitive info before anyone notices, your logs might be the only hint.
Tooling Breakdown: How to Surface Automation Signals
It’s one thing to know what to look for — it’s another to actually see it in the logs. Most teams already collect logs, but they don’t configure them to reveal behavior. Below are the tools you need and the flags, filters, or queries that make them useful.
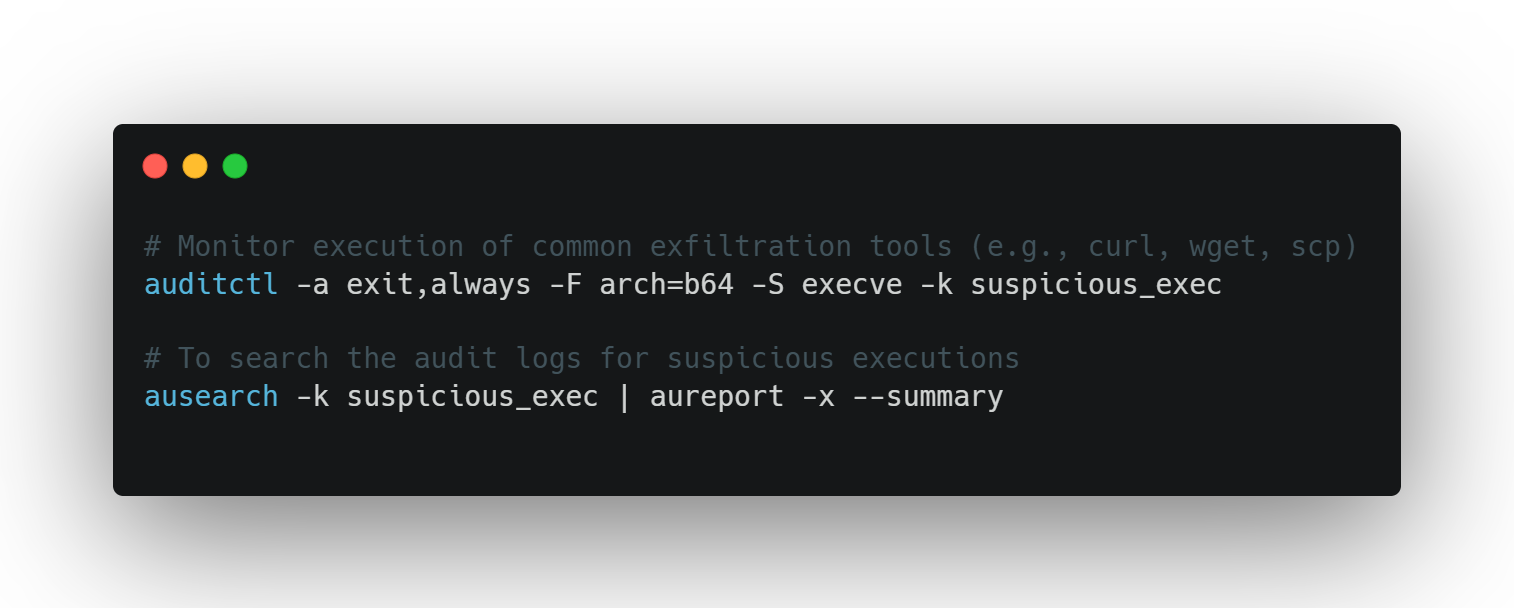
1. auditd (Linux)
Best for:
Tracking process launches
Monitoring file access and syscalls
Detecting odd combinations like
pythoncallingcurl
How to use:
What to look for:
Repeated script-triggered binaries
Odd timing (e.g., executions at 2am)
Service accounts launching tools outside their expected profile
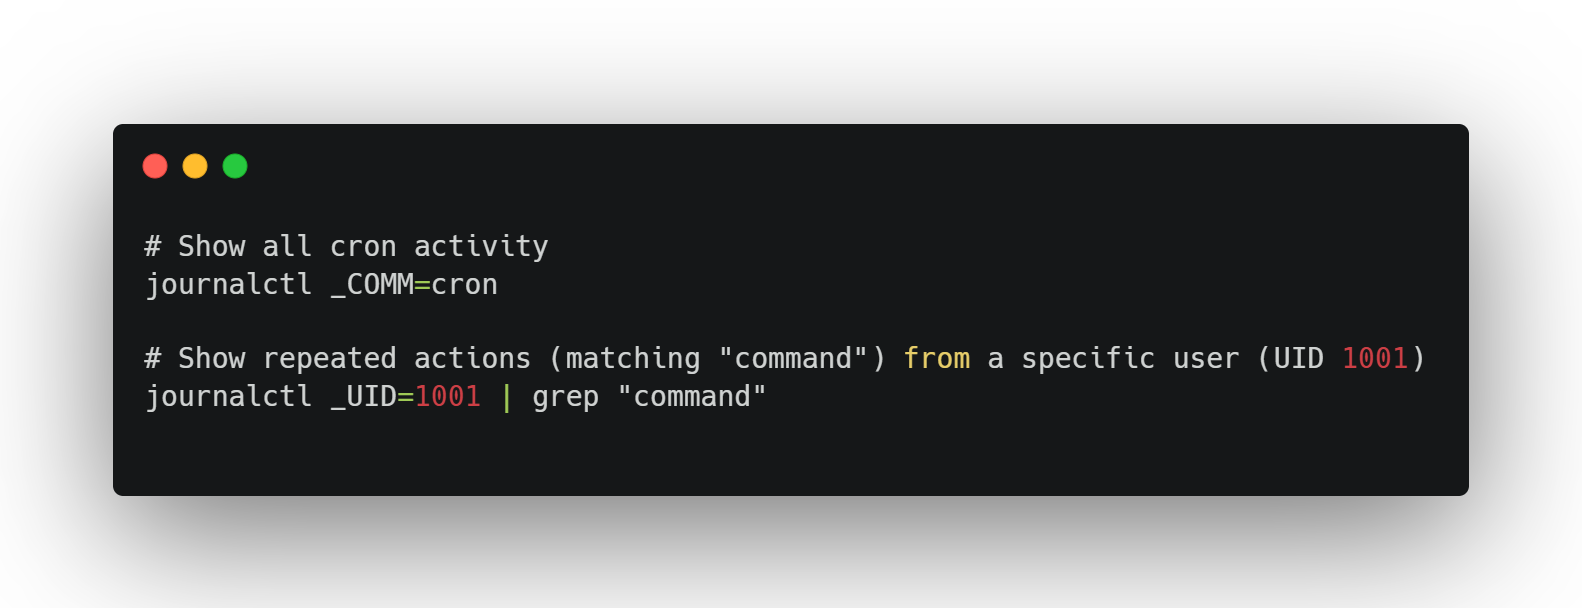
2. journalctl / syslog
Best for:
Quick checks on system service behavior
Debugging cron jobs, user sessions, failed auth attempts
Example:
What to look for:
Repeated log entries at fixed time intervals
Services running unexpectedly under root or legacy users
3. AWS CloudTrail
Best for:
Identifying overactive IAM roles
Detecting credential re-use
Tracing high-frequency or unusual API activity
Example query (Athena or CloudTrail Lake):
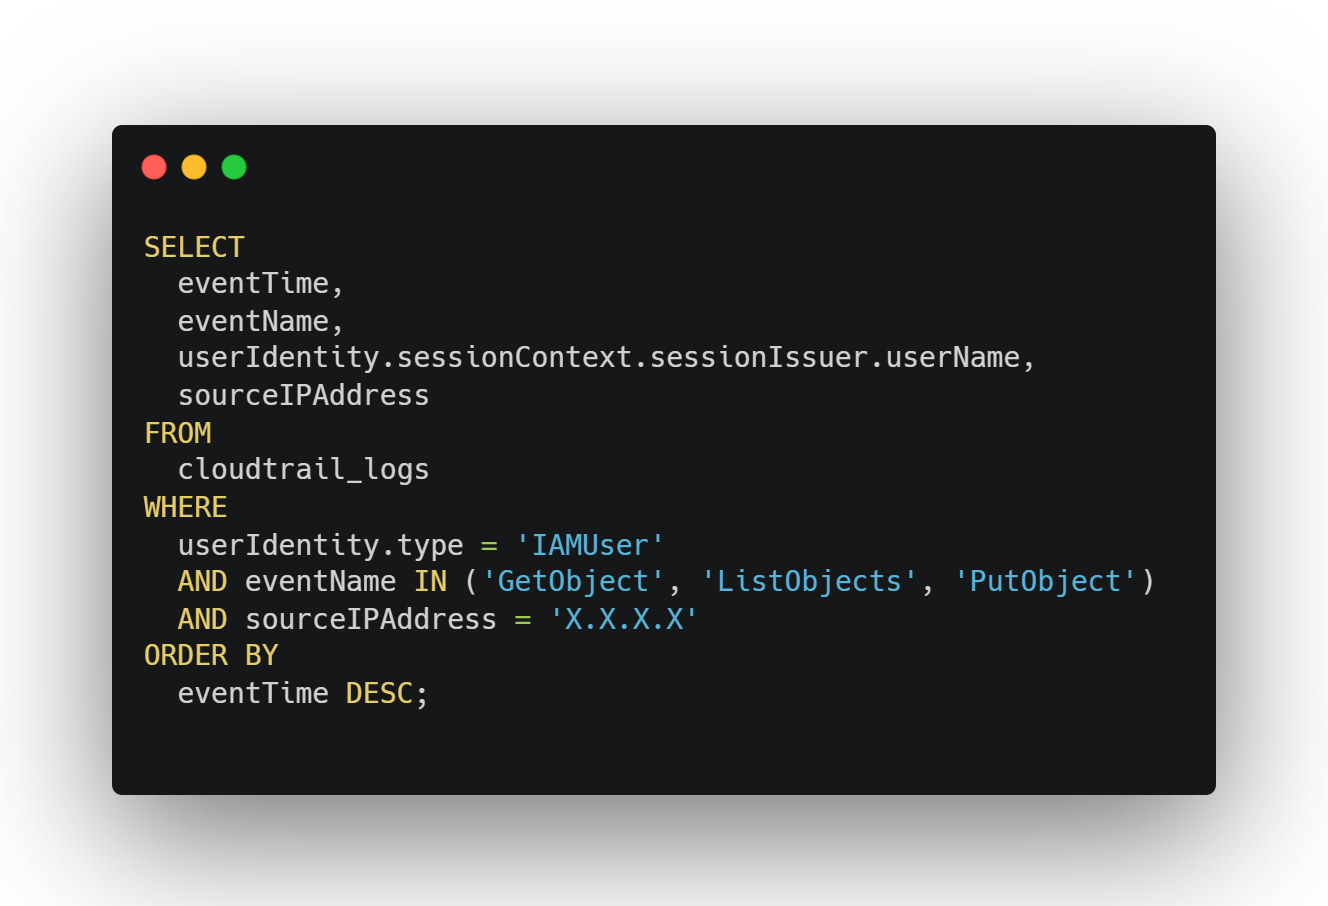
What to look for:
Same IP hammering S3 or EC2 APIs
Unusual frequency patterns (thousands of calls in short bursts)
Tokens that show up in both dev and prod
4. GCP Logging (Log Explorer)
Best for:
Observing service account behavior
Surfacing repetition in cloud function or API Gateway activity
Example filter:
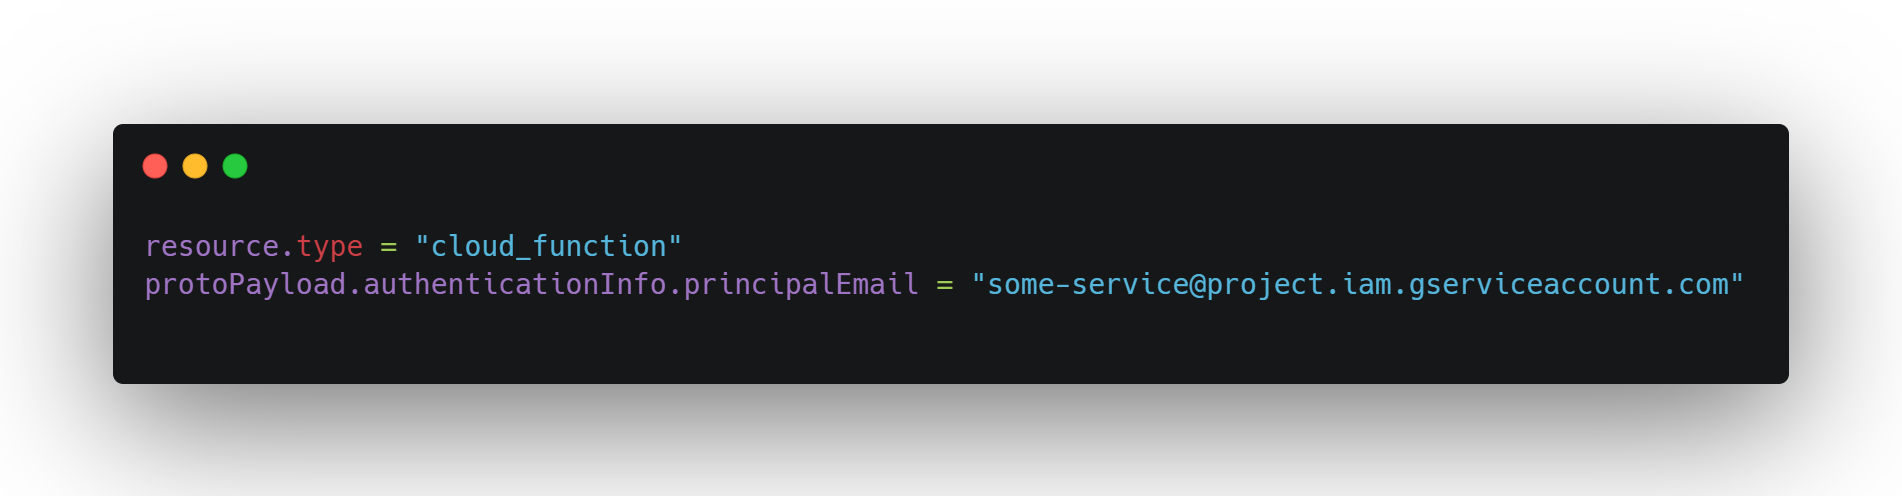
What to look for:
Same principal making repetitive API calls
Scheduled tasks behaving outside declared SLAs
5. Optional: OPA / Rego for Policy Validation
If you're running Kubernetes or Terraform, you can write policy-as-code to flag automations that violate timing, source, or identity expectations.
Example Rego concept:
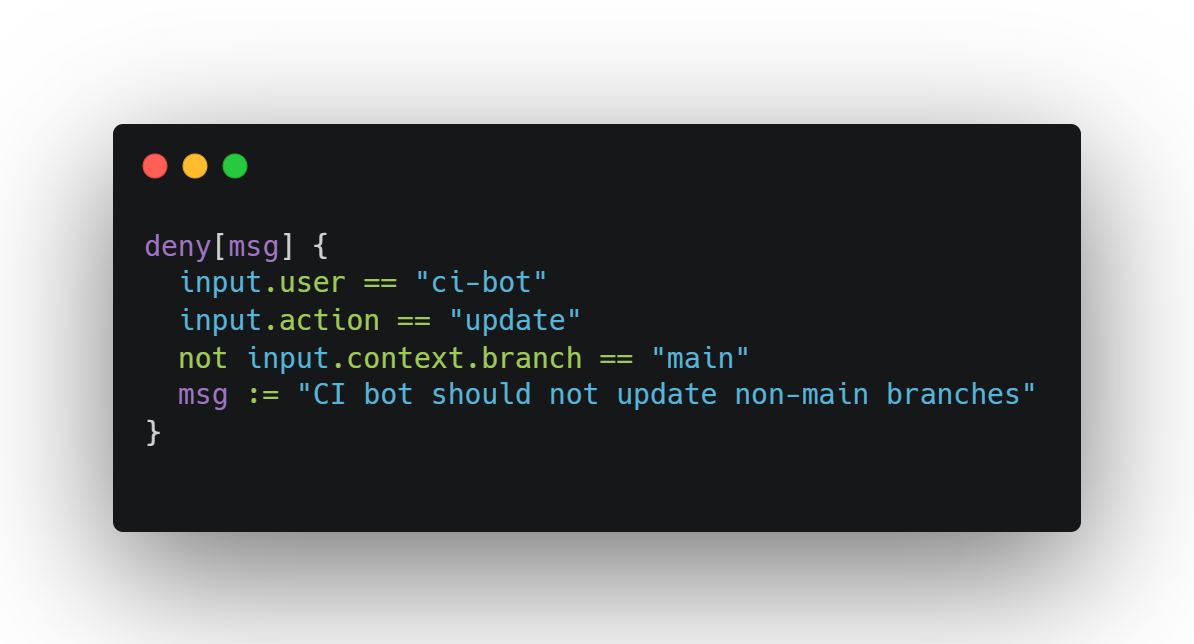
Why use it:
To prevent privilege creep and behavioral drift before it hits production logs.
In short: the tooling is there — the trick is using it with intent.
Logs only surface anomalies if you give them context. That means writing rules, filtering noise, and knowing what “normal” looks like in your environment.
Walkthrough: Detecting a Forgotten Cron Job Leaking Data
Let’s walk through a realistic scenario: A legacy cron job is quietly dumping data from a sensitive internal database into a public S3 bucket — daily, at 3:00am.
It wasn’t malicious. It was part of a now-deprecated export pipeline that no one officially owned. It kept running because no one ever removed it.
No alerts fired. But the logs were there — and they were noisy.
Step 1: Surface Suspicious Timing
You start by scanning for recurring job activity outside standard hours.
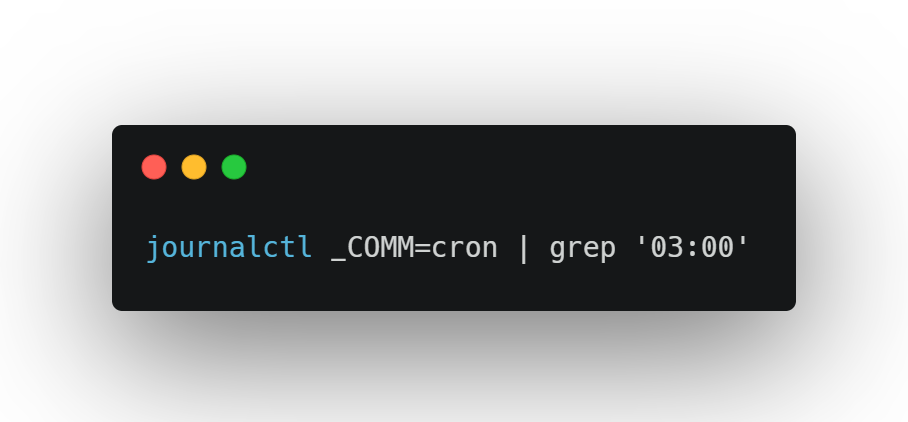
You notice a daily execution pattern:
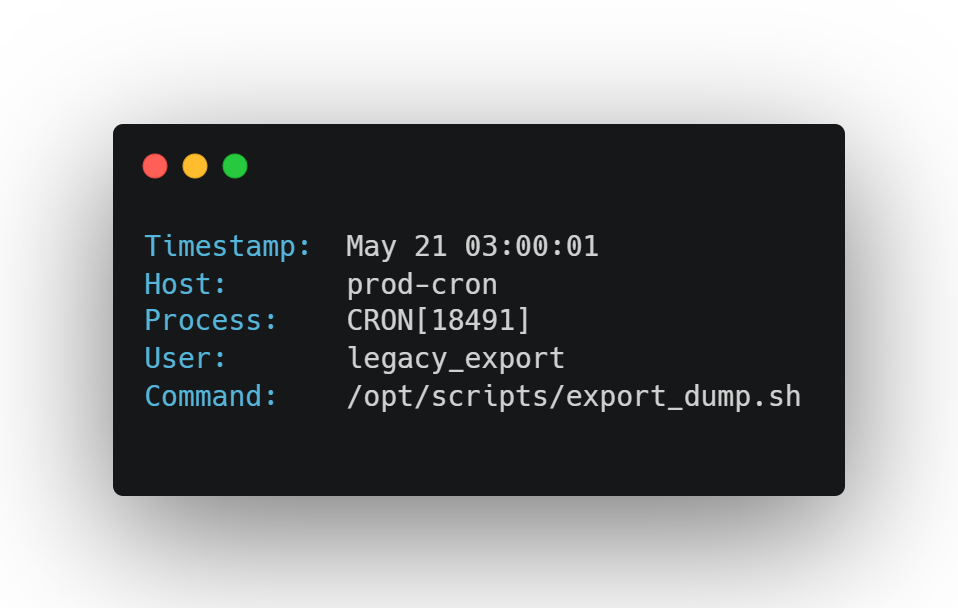
You check the script path — it still exists. Owned by a long-departed engineer. The output path? A CSV uploaded to an S3 bucket named data-lake-archive-public.
Step 2: Cross-Check with Cloud Logs
In AWS CloudTrail:
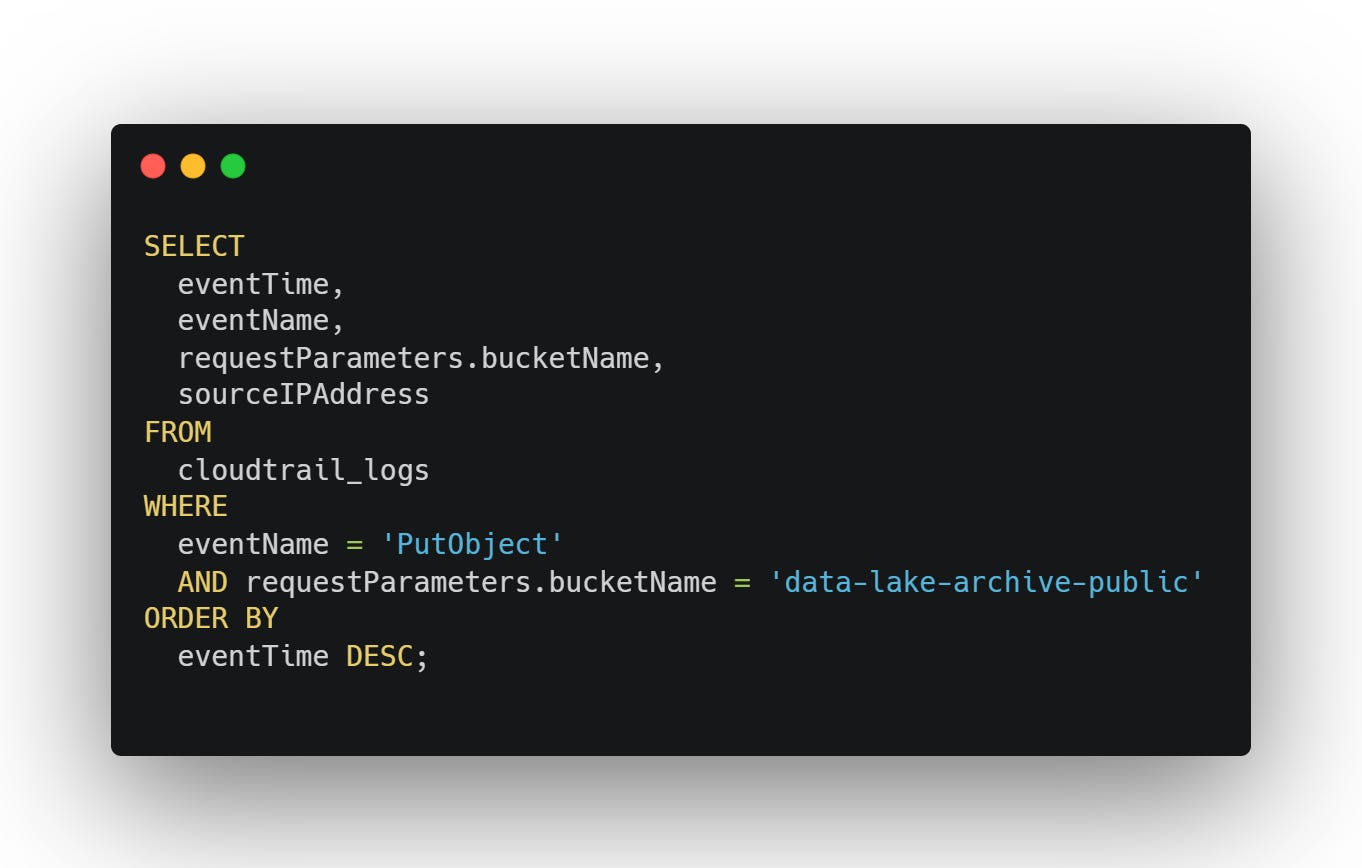
You see daily uploads from the same internal IP. It’s the EC2 instance running the legacy cron. Same object prefix each day. No encryption. No auth.
Step 3: Confirm Automation Pattern
Back on the host:
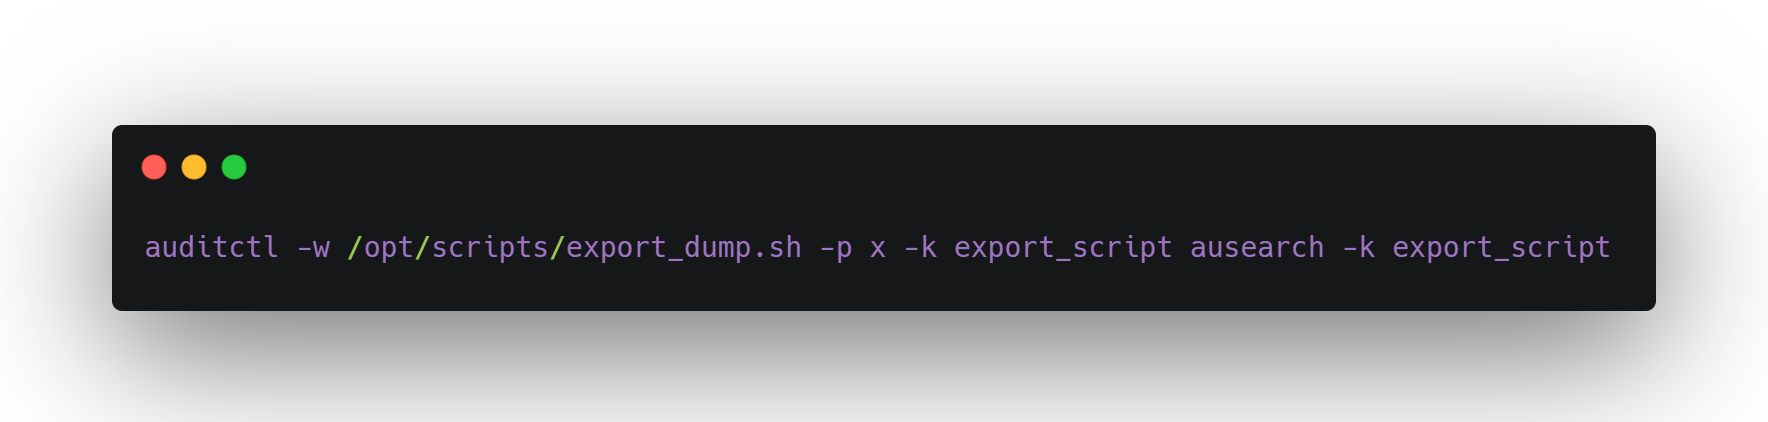
You watch it fire every 24 hours, exactly on time — with no human login to the machine. It’s fully automated, running unattended.
Step 4: Contain, Then Clean
You:
Disable the cron job.
Revoke the IAM access used by the EC2 instance.
Audit the S3 bucket’s ACLs and encryption settings.
Notify the data team that any public exposure risk must be documented.
No breach occurred — but it could have, and no one would have known.
What caught it?
Not a WAF. Not a cloud security scanner. Just boring system logs, showing a pattern that didn’t make sense — once someone actually looked.
How to Make This Sustainable
Detecting suspicious automation once is easy.
Catching it before it becomes a problem — every time — requires structure.
Most teams don’t need more tools. They need better habits around the tools they already have. Here’s how to make that happen without turning every engineer into a full-time log analyst:
1. Schedule Anomaly Reviews Like You Do Standups
Don’t wait for incidents. Build log review into your rhythm — weekly if you’re small, daily if you’re high-risk or high-scale.
What to look for:
New service accounts or roles you didn’t expect
Repetitive access patterns at strange hours
High-frequency API activity or S3 events
You don’t need a SIEM. Just:
A saved query in CloudTrail or GCP Log Explorer
A Slack alert from a cron job that runs a shell script +
grepA 30-minute calendar block where someone actually reads the logs
If it’s not scheduled, it’s not sustainable.
2. Use Structured Logging (and Label Automation Properly)
The fastest way to distinguish between humans and scripts is to log them differently — but most teams don’t.
Log this:
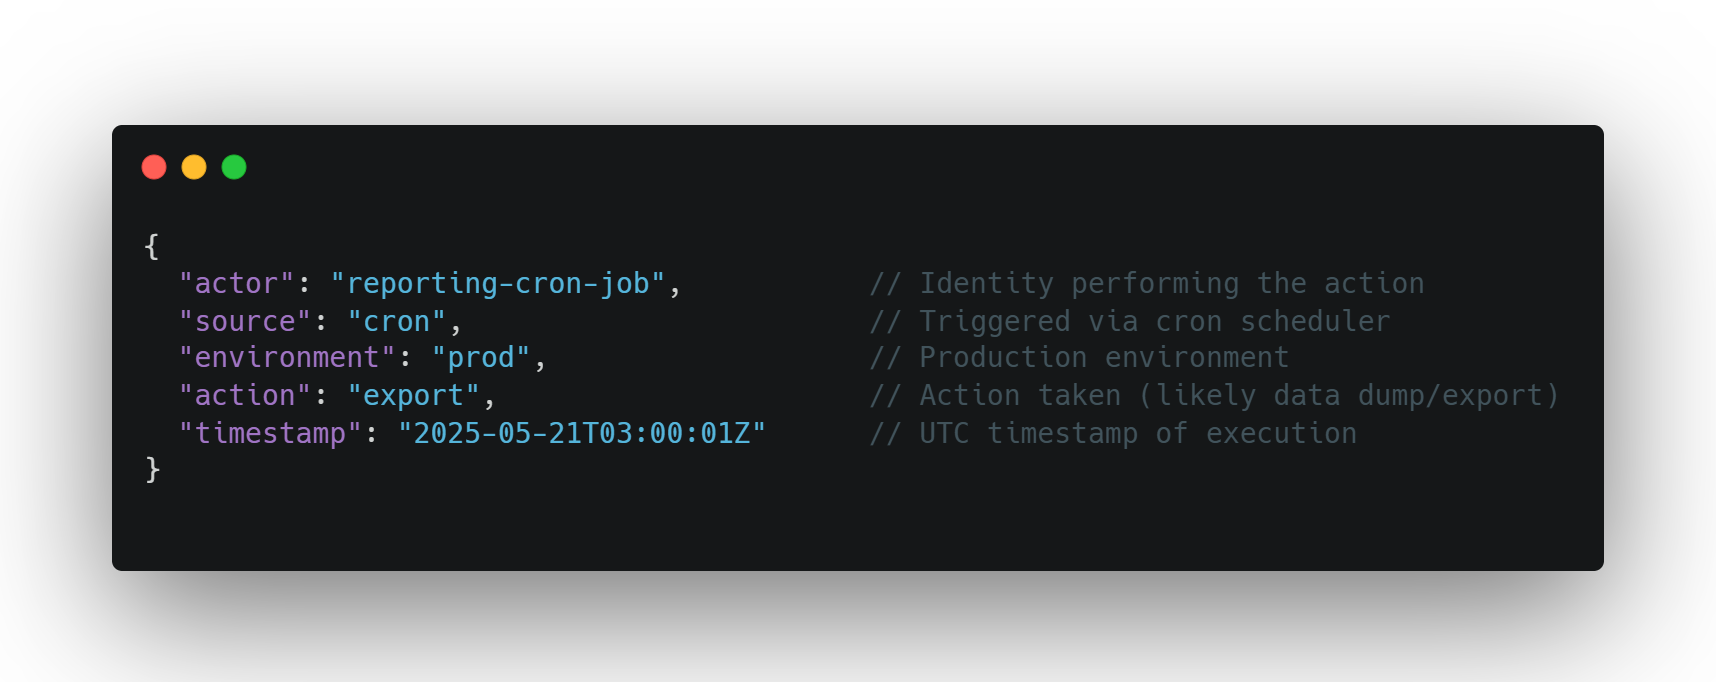
Not this:
Every script or tool should identify itself clearly — via metadata, headers, service account naming, or even log tags. When automation announces itself, you can flag what doesn't.
3. Track Automation Like You Track Infrastructure
If it’s running in production and no one knows where it lives in Git, it’s a risk.
Bash scripts, Lambda functions, leftover Jenkins jobs — these things tend to escape version control. And when they do, they escape visibility, auditability, and eventually responsibility.
Fix it by:
Declaring automation jobs in Terraform or Pulumi
Tracking them in your IaC repo, even if they’re just cron or shell
Tagging every automation resource with owner + purpose metadata
This isn’t just good practice — it makes detection possible. You can’t spot rogue automation if you don’t know what “legit” automation looks like.
The takeaway? Make automation a first-class citizen in your infra. Give it structure, visibility, and logging — and it’ll stop being a silent threat.
Automation isn’t the problem. It’s the silence around it.
We build systems to move faster, to scale without friction, to remove humans from the loop. But when those systems start behaving unexpectedly — or continue behaving long after they should’ve stopped — we don’t always know where to look. Or who to ask.
Most breaches don’t start with malware. They start with a forgotten script, a reused key, a job that nobody owns but everybody depends on.
Logs won’t solve that for you. But they’ll show you where to start.
If you want secure infrastructure, don’t just log everything. Read it.
Because buried somewhere in the repetition, in the timestamped noise, is a story about how your systems are actually behaving — whether you meant for them to or not.